Working with the Heatmap#
The heatmap is a graphical representation of data where the individual values contained in the Dependency Structure Matrix (DSM) are represented as colors
Viewing a Heatmap.#
Viewing a Heatmap is controlled by the “Heatmap Selection” in the toolbar. There are two types of heatmap views.
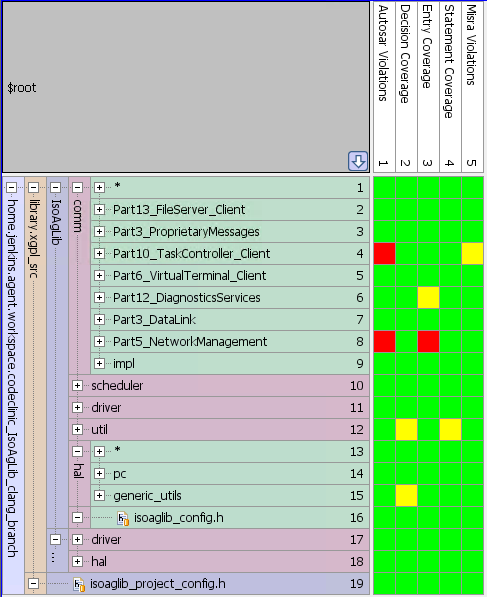
Heatmap Grid#
The Heatmap Grid shows all the available metrics in a grid next to the subsystems. First, open a DSM view, then select “Heatmap Grid” from the “Heatmap selection” dropdown. This will display a grid with all of the heatmap colors for each metric. The Red color indicates that the subsystem contains a metric value that exceeds the threshold value.
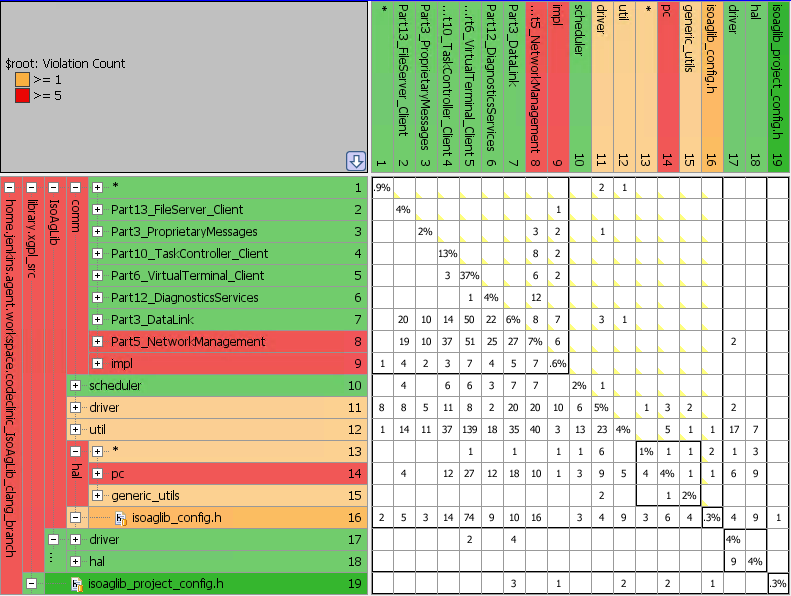
Single metric heatmap#
The other selections in the “Heatmap Selection” dropdown are individual metrics that can be viewed in the heatmap. First, open a DSM view, then select on of the metrics from the “Heatmap Selection” dropdown.
Adding metrics to the Heatmap#
To view the Heatmap metrics properties go to Project –> Project Properties and click on “metrics” on the left side of the dialog box. You can turn on and off metrics in the heatmap by click the checkbox on which metrics you want to see. You can also change the threshold values. For example, system stability by default has a warning threshold of 80% and a fail threshold of 50%.