Lattix Web Project Page#
When you come to the Project page the latest snapshot is selected. You also see a default set of reports, charts and views. You can use the toolbar to select a different project or a different snapshot of the selected project.
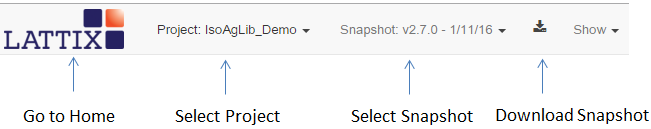
Individual snapshots can be downloaded as files or directly loaded into Architect. When you select to show a report, chart or view it is displayed in a new tile.The tiles themselves can be moved around using the settings menu (gear shaped) on each tile.There may be additional selection options on each tile that are specific to a tile. Furthermore, the views are also interactive.
Here are some example tiles:
Tile for System Metrics Delta
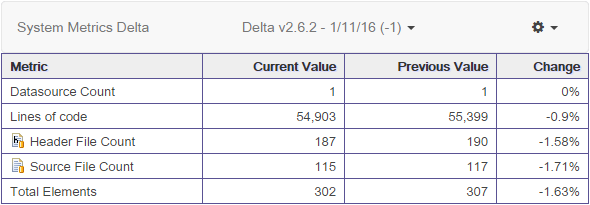
The Delta option allows you to choose a snapshot to compare against the selected snapshot of this project.
Tile for System Stability Metrics
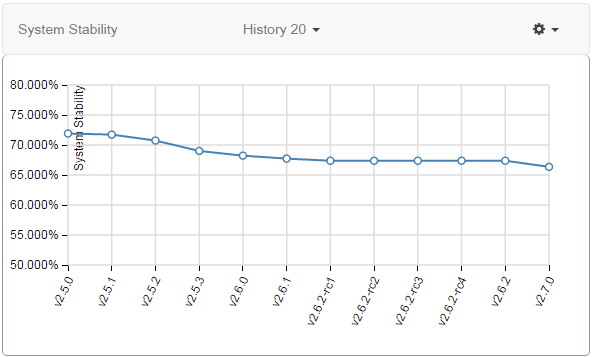
The history option allows you to control the number of snapshots to display ending with the selected snapshot.
You can also create a DSM and CAD View. Here is an example of a DSM View:
Tile for a DSM View
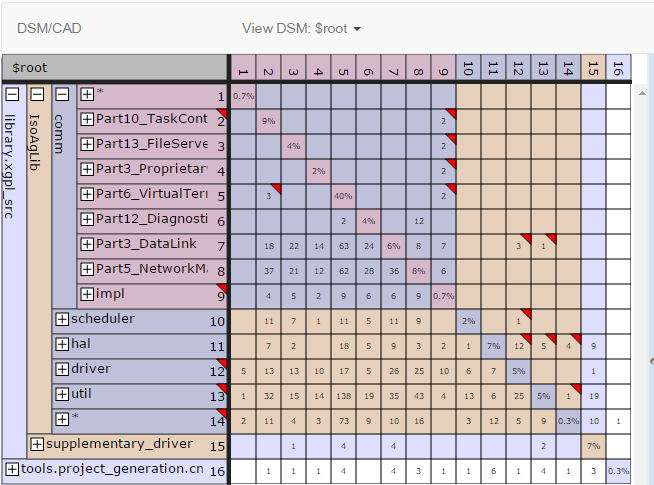
The View DSM option allows you to view any DSM or CAD that exists in the snapshot. The DSM: default selection allows you to create a new DSM. The DSM View is interactive. You can expand and collapse the DSM at any level of the hierarchy. You can select a subsystem or a cell and see the associated dependencies in a pane on the right.
Tile for Issues View
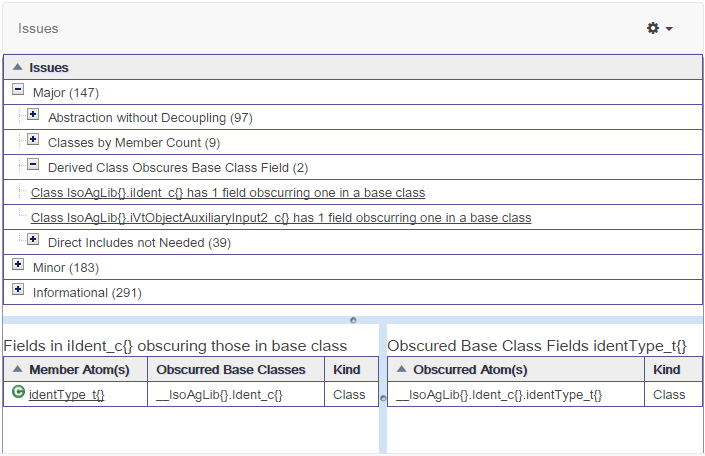
The Issues View is interactive. You can select an issue in the top pane and drill further into it in the bottom panes.
List of Reports#
Snapshot reports#
These reports are based on the currently selected snapshot.
System Metrics: Get lines of code and count of various element types.
Architecture Metrics: : Get Complexity, System Cyclicality, Intercomponent Cyclicality, Stability, Coupling, Cycles, and Violations.
Largest Atoms: Get a list of the top 10 of the largest files by lines of code for projects based on programming languages such as C/C++, Java, .NET etc..
Cycles: Get list of all high level cycles.
Low Level Cycles: Get list of low level cycles.
Object Oriented Metrics: Get efferent, afferent, instability, abstractness and distance for each package.
Violations: Get list of rule violations.
Worklist: Get list of work list items.
Rules: Get list of all rules.
Flagged Cells: Get list of all cells which have been flagged.
Largest Compound Package: Get list of Get a list of the largest packages/directories that contain other packages/directories.
Largest Packages: Get a list of packages that contain a large number of files.
Delta reports#
These reports are based on the currently selected snapshot and a delta snapshot.
Missing Violations: Earlier violations that no longer exist in the currently selected snapshot.
New Violations: New violations in the currently selected snapshot.
Missing Atoms: Atoms (files, classes …) that no longer exist in the current snapshot.
New Atoms: Atoms (files, classes …) that are new in the currently selected snapshot.
System Metrics Delta: The difference in the System Metrics between the current and the delta snapshot.
Architecture Metrics Delta: The difference in the Architecture Metrics between current and delta snapshot.
Architecture Changes: The difference in atoms, violations between the current and delta snapshot. This is similar to the update report or the ldcdiff report.
Impact Report: The impact of changes computed to transitive closure based on the new and changed atoms.
List of Charts and Views#
Charts#
The following metrics can be charted over last 5, 10, or 20 snapshots:
Types
Complexity
System Cyclicality
Intercomponent Cyclicality
System Stability
Coupling
Violations
Views#
The following views can be created for the currently selected snapshot:
DSM: You can create a new DSM or display and interact with one that is in the current snapshot.
CAD: You can display the CAD that is in the current snapshot.
Issues: You can examine and drill down into the architectural issues identified by builtin checkers.